At Next Generation Insurance Group, we’ve used digital as a point-of-sale and point-of-quote for insurance products since our founding. As you might imagine, the ecommerce and user experience landscapes have changed dramatically during that period, but nowhere is that change more dramatic than in the use of mobile by insurance buyers.
It’s clear after an analysis of our own data that there has been a tectonic shift in the hardware preferences of insurance prospects over the past five years.

Mobile Analytics: GradGuard.com
Let’s first check out GradGuard.com, our higher education business at NGI. GradGuard is the leading consumer-centric insurance and benefits solution designed to meet millennial consumers where they are, not only across different platforms but also product verticals.
The peak season for GradGuard products is May through September. In 2010, mobile comprised a paltry 1% of traffic to GradGuard.com during the site’s peak season. One percent! Half of one percent of the site’s conversions occurred on mobile devices.
In present terms, it’s intuitive to state that in order to meet millennials where they are, your company needs a strong mobile practice. (This we luckily have at NGI.) But looking back to 2010, it’s easy to understand why we paid barely a passing interest to mobile.
Fast forward to peak season 2015, which just concluded: 38% of traffic to GradGuard.com originated from a mobile device and 16% of all insurance policy sales occurred via a mobile device. Five years ago, 1% of GradGuard.com’s traffic came from mobile. Five years later, 16% of its SALES came from mobile. It’s crazy.
The use of mobile by insurance prospects isn’t limited to speciality products found on sites like GradGuard.com – it extends even more dramatically to more ubiquitous products like car insurance. MassDrive.com, the Massachusetts-focused website that’s part of our national auto and home insurance business, has seen an even larger explosion in mobile activity. (I opted to use MassDrive.com for this exercise instead of the site for our national auto and home insurance solution, MyLifeProtected, because this business was exclusively located in Massachusetts back in 2010.)
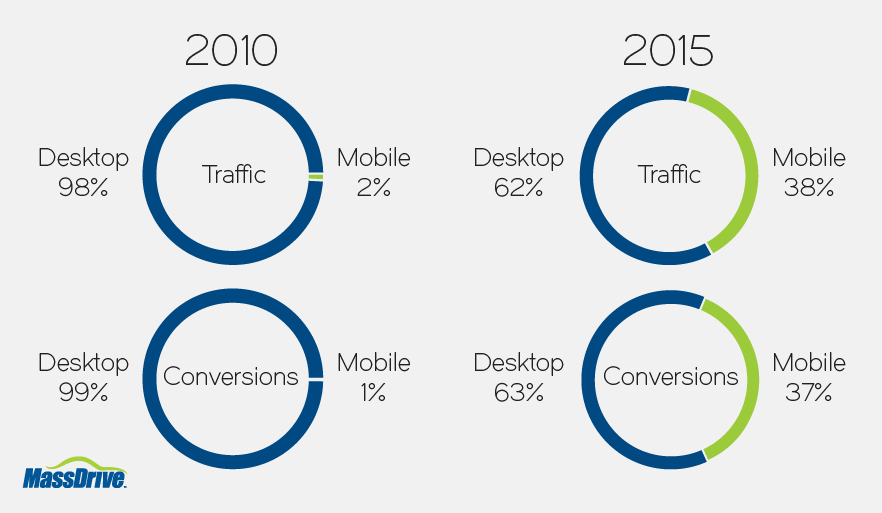
Mobile Analytics: MassDrive.com
I looked at the last three months on MassDrive.com versus the same period in 2010. From 8/1/10-10/30/10, less than 2% of traffic to MassDrive.com originated from a mobile device. Like GradGuard, less than 1% of conversions overall were generated on a mobile device. Times have changed in 2015; for the same period this year, 38% of traffic to MassDrive.com came from a mobile device and an unbelieveable 37% of total conversions occurred on a mobile device.
(In the case of MassDrive.com, the conversion rate on mobile devices is nearly identical to the conversion rate on desktops; there is a much larger variance in desktop and mobile conversion rates on GradGuard.com, where the desktop conversion rate is significantly higher than mobile. We’re not sure why that is, but we’re looking at it.)
These and similar data points are impacting how we market and approach our process and experience designs at NGI. What was something of an afterthought five years ago is now an active part of our creative, engineering, and QA operations.
The data tells us that insurance prospects are ready to buy on mobile – we’re focused on capturing them with an experience worthy of that expectation.